











 Health Analytics: Clinical, operational and financial dashboards for management
+$38.40/mo at 20 practitioners. Free instant access, no credit card required.
Works with
 HMS Core
What's inside
Everything in Health Analytics
63 items in 15 areas, every one shipping with the app today.
Executive Dashboards (OWL)
- CEO DashboardBoard-level screen with revenue, gross margin, operating margin %, new patients, total visits, admissions, bed occupancy and CSAT KPI cards.
- CEO revenue and patient trends12-month revenue trend and new-patient volume trend charts rendered from daily snapshots.
- CEO revenue mix breakdownCash vs mobile money (M-Pesa) vs insurance revenue mix chart for the selected period.
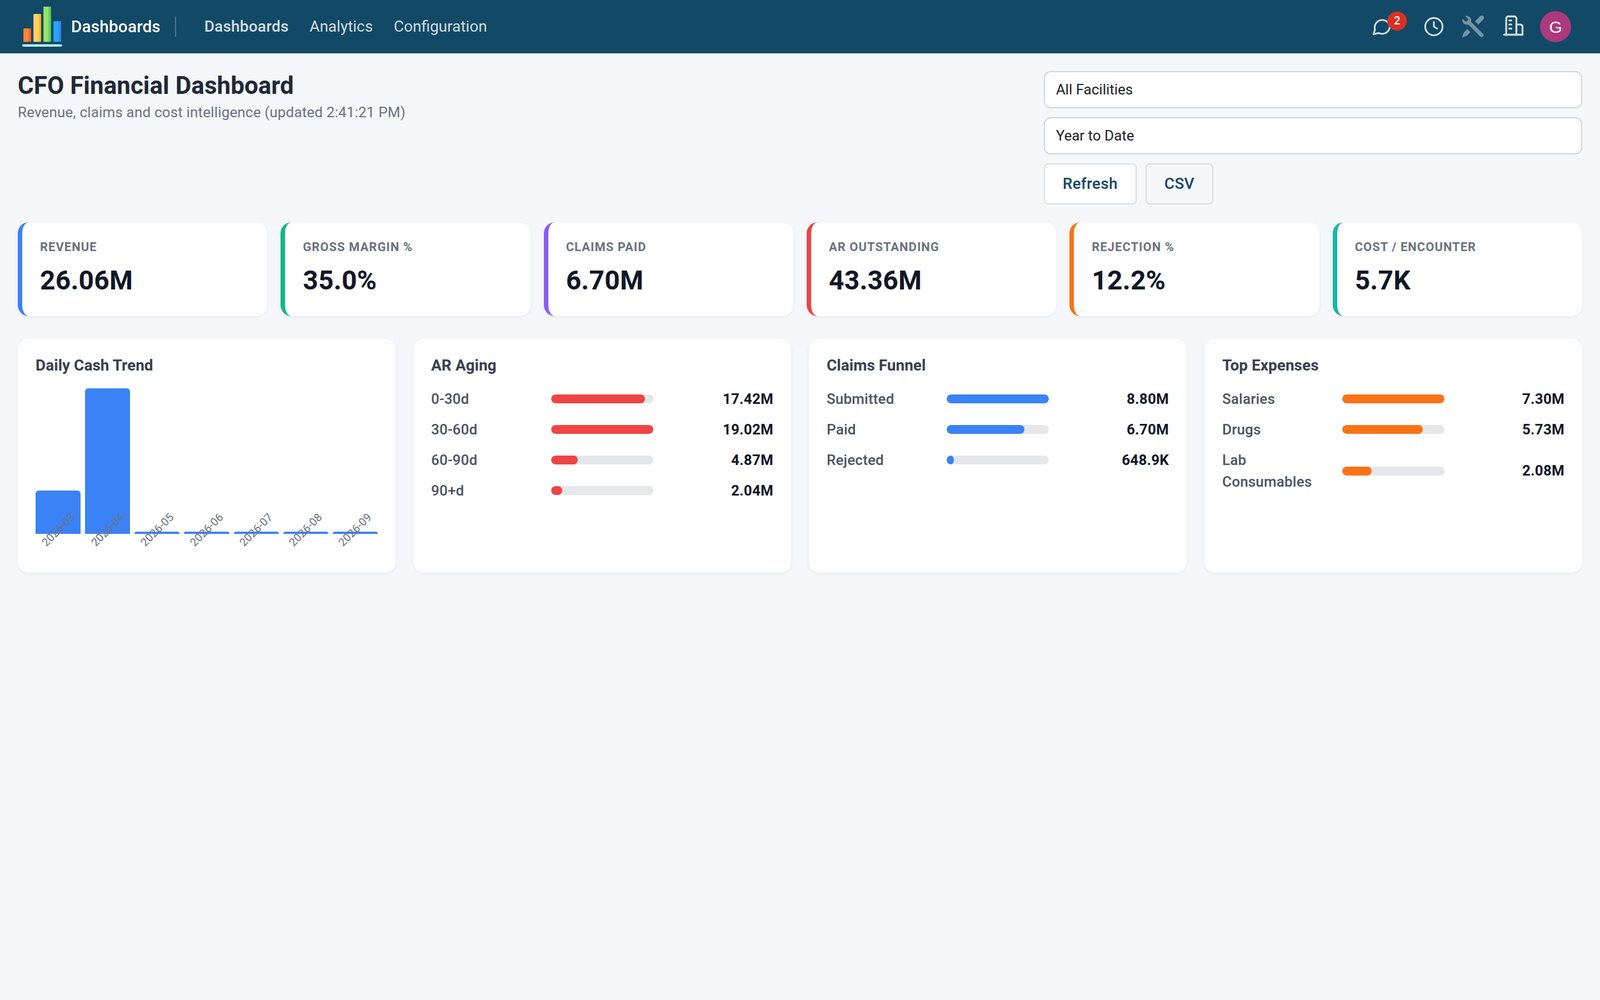
- CFO DashboardFinance screen with total revenue, VAT collected, gross margin %, claims paid, claims outstanding, cost per encounter and claim rejection rate KPIs.
- Claims A/R aging chartCFO view buckets outstanding insurance claims into 0-30, 30-60, 60-90 and 90+ day aging bands.
- Claims funnel viewSubmitted vs paid vs rejected claim values visualised as a funnel on the CFO dashboard.
Daily KPI Snapshot Engine
- Nightly automated snapshot cronA scheduled job runs daily at ~23:55 and builds one KPI snapshot per facility, per date.
- 55+ KPI fields per snapshotEach daily row captures patient, visit, inpatient, clinical, revenue, expense, claims, compliance and engagement metrics.
- Patient volume metricsCounts new patient registrations for the day and the total active patient base.
- Visit and consultation metricsOPD, IPD, emergency and teleconsult visits, total consultations and average consult duration in minutes.
- Inpatient flow metricsAdmissions, discharges, deaths, 30-day readmissions, bed occupancy %, bed-days utilised and average length of stay.
- Clinical volume metricsSurgeries, deliveries, lab tests, critical lab values, imaging studies, Rx lines dispensed and OTC sales.
Custom Report Builder
- Self-service report designerUsers build reports by choosing a source dataset, filter domain, group-by fields, measure fields and chart type.
- Eight HMS data sourcesReports can query snapshots, visits, admissions, consultations, prescriptions, lab requests, bills or insurance claims.
- Seven chart typesBar, line, pie, scatter, area, table or KPI-card rendering per report.
- Domain validationFilter domains are safely parsed with a clear error message when the expression is invalid.
- Draft / Ready / Archived lifecycleStatusbar workflow with Mark Ready and Archive buttons and chatter tracking on every change.
- Run with row-count feedbackRun button executes the query (a grouped summary or a 500-row search) and shows how many rows were produced.
Scheduled Digests
- Digest subscriptionsNamed email digest subscriptions with daily, weekly or monthly cadence and active toggle.
- Composable digest sectionsEach subscription picks which summaries to include: CEO, CFO, CMO and/
or Operations. - Internal and external recipientsSend to selected users plus comma-separated external email addresses, optionally scoped by group.
- Send Now buttonFire the digest email immediately from the form, with the last-sent timestamp recorded.
- Weekly and monthly digest cronsTwo scheduled jobs automatically dispatch all active weekly and monthly digests.
- Digest mail templateShips an email template for the executive digest with per-recipient addressing.
Benchmark Registry
- Benchmark catalogRegister KPI benchmarks with metric name/
code, unit, facility value, benchmark value, as-of date and notes. - Four benchmark sourcesClassify each benchmark as ministry of health (such as MoH Kenya), industry survey, internal target or peer group, with a source reference.
- Automatic above/at/below ratingA stored computed badge compares facility value to benchmark within a 2% tolerance.
- 12 pre-loaded industry benchmarksShips bed occupancy, CSAT, readmission, claim rejection, lab TAT, OPD wait, mortality, ALOS, no-show, CPD, margin and claims-aging targets with cited sources.
- Per-facility benchmark trackingBenchmarks can be scoped to a facility and archived via an active flag.
- Benchmark catalogRegister KPI benchmarks with metric name/
PDF Reports & Email
- CEO Monthly Summary PDFQWeb PDF report bound to snapshots and available from the record's Print menu.
- CFO Financial Summary PDFPrintable financial summary covering revenue, expense and claims figures.
- CMO Clinical Quality PDFPrintable clinical-quality report of mortality, readmission and safety metrics.
- Operations Weekly PDFPrintable weekly operations throughput and occupancy report.
- Custom report PDF rendererGeneric QWeb template renders any user-built custom report to PDF.
Security & Access Control
- HMS Executive roleAdds a dedicated HMS / Executive security group (implying HMS Manager) for board-level analytics access.
- Granular per-model rights13 ACL lines tune read/
write/ create/ delete separately for Manager, Admin, Executive and Doctor roles across all four models. - Multi-company record rulesSnapshots and digests are filtered to the user's allowed companies.
- Owner-or-shared report privacyA record rule limits custom reports to their owner unless explicitly shared with the team.
- Role-gated menusEvery menu entry is restricted to Manager, Admin or Executive groups; CEO/
CFO boards are executive-only.
Navigation & Integration
- Analytics hub under DashboardsFull menu tree (Executive Overview, four dashboards, Custom Reports, Daily Snapshots, Benchmarks, Configuration) mounts under Spreadsheet Dashboards.
- Configuration submenuAdmin-only Configuration area for managing digest subscriptions and benchmark sources.
- Plug-and-play HMS suite integrationOnly HMS Core is required; billing, claims, laboratory, pharmacy, ward, messaging and staffing apps enrich the KPIs when present.
- Multi-currency awareAll monetary KPIs carry the company currency, and dashboards display the active currency code.
- Demo dataset includedDemo data plus the backfill routine give a fully populated analytics suite out of the box for evaluation.
Custom Reports
- New Report
- My Reports
- Shared Reports
- Scheduled Reports
Configuration
- Digest Subscriptions
- Benchmark Sources
Analytics
- Daily Snapshots
- Benchmarks
Documents it prints
- CEO Monthly Summary
- CFO Financial Summary
- CMO Clinical Quality
- Operations Weekly
- Custom Report
It runs by itself
- HMS Analytics: Build Daily SnapshotsRuns daily
- HMS Analytics: Weekly DigestRuns every 7 days
- HMS Analytics: Monthly DigestRuns monthly
- HMS Analytics: Refresh Custom ReportsRuns daily
Roles it ships
- HMS / Executive
What it sends
- HMS Analytics: Executive Digest
Works with
What Health Analytics works with
Health Analytics shares one database with the rest of the Bridge HMS Suite and BridgeERP: these are the apps it already talks to, with nothing to buy in between.
Builds on
Health Analytics needs these to run; they come with it in the same plan.
And the wider platform
Any BridgeERP app can join the same database.
 AccountingFull double-entry accounting, bank reconciliation, assets, budgets and statutory reports.
 ExpensesEmployee expense claims with receipt capture and reimbursement.
 InvoicingCustomer invoices, vendor bills, payments and tax handling.
 SignSend documents for legally binding electronic signature.
 SubscriptionsRecurring contracts, automatic renewals and MRR reporting.
 EmployeesEmployee records, contracts, attendance, skills, appraisals and referrals.
In the suite
More Bridge HMS Suite apps
- HMS Core
 Reception
 Appointments
 Consultation / OPD
 Electronic Health Record
 Laboratory
 Pathology
 Radiology & PACS
 Pharmacy
 Billing & Cashiering
 Insurance & Claims
 Wards & Inpatient
 Nursing
 Operating Theatre
 Intensive Care
 Emergency
 Blood Bank
 Dialysis
 Maternity
 Paediatrics
 Dental
 Ophthalmology
 Specialty Packs
 Telehealth
 Patient Portal
 Ambulance
 Mortuary
 Medical Stores
 Dietary
 CSSD
CSSD Infection Control
 Quality & Accreditation
 Bria Clinical AI
 Interoperability
 Public Health
 Country Compliance
 Biomedical Engineering
 Facility Helpdesk
 Housekeeping
Put Health Analytics to work
Add it to your Bridge HMS Suite plan, priced per practitioner, or start a free trial and see it running first.