

CRMlesson 4 of 4
Written lesson
Turn the pipeline into a graph or a pivot table, group it the way you need, and save it as a favourite.
Read the lesson →Read your pipeline
Course contentslesson 4 of 4
Lead Management13 min
Performance Analysis5 min
What Performance Analysis gets you to
- Turn the pipeline into a forecast you can group, filter and keep
The opportunities you work on every day are also the data for your sales reports. Switch views instead of exporting.
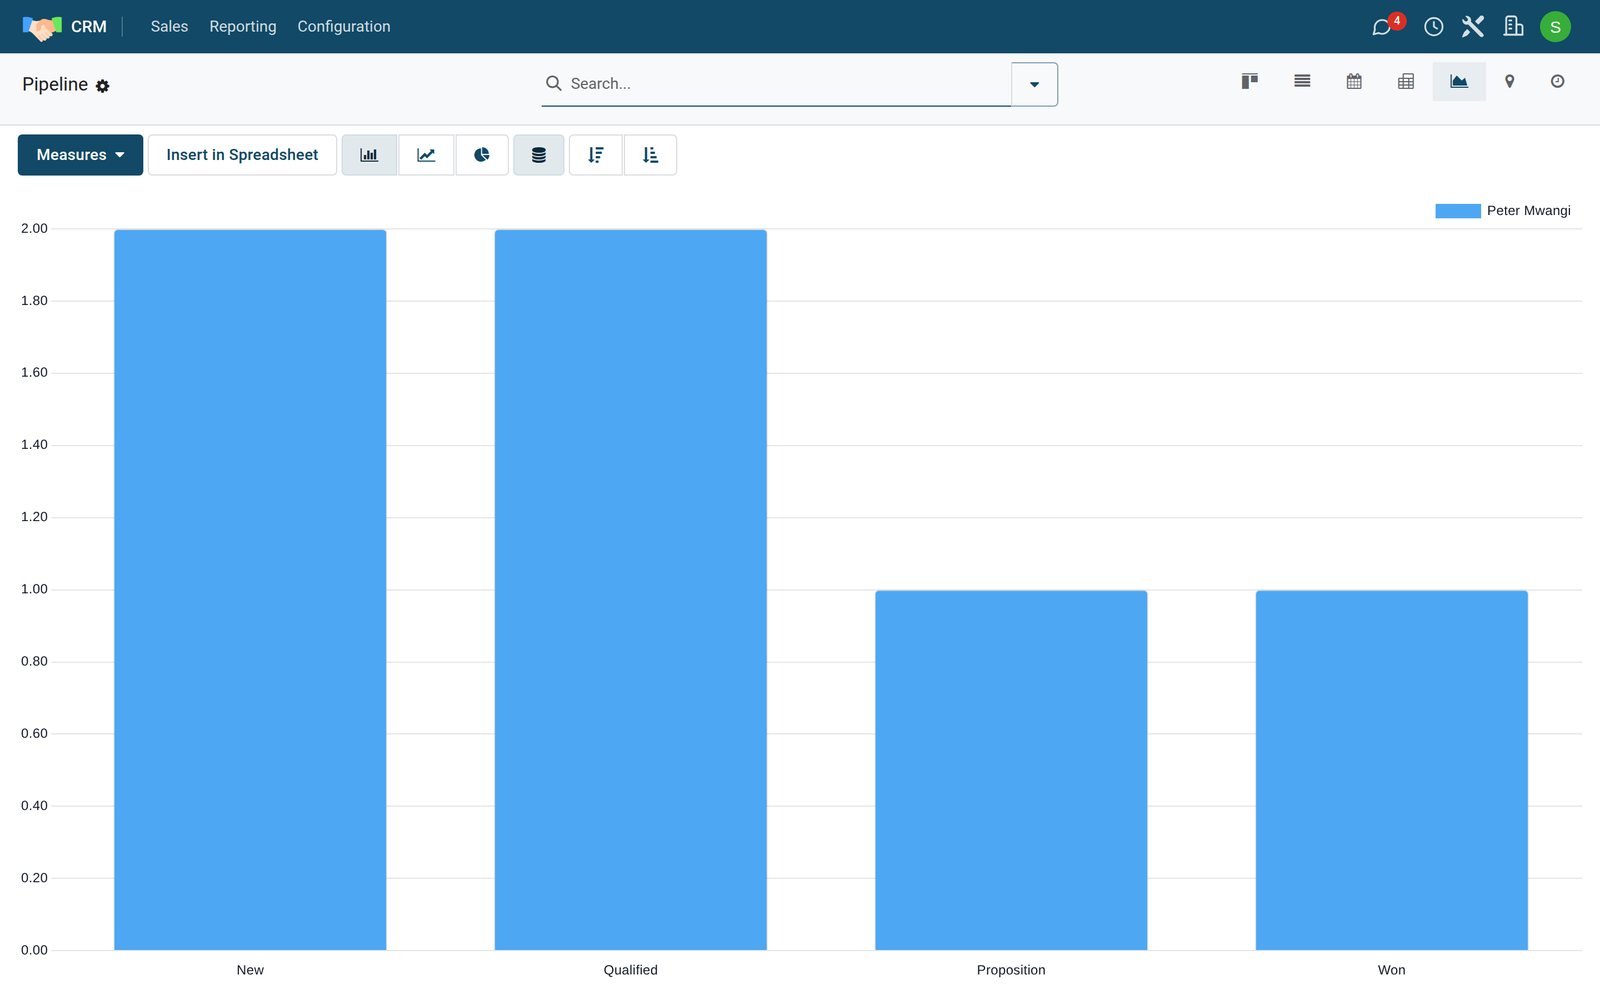
Graph and pivot
- The graph view draws bars, lines or a pie. Measures chooses what is added up: the number of opportunities, or the Expected Revenue, the Prorated Revenue and more.
- The pivot view is a table: put stages in rows and salespeople in columns, for example, and click a heading to break it down further.
Prorated Revenue is the expected revenue multiplied by the probability. Added up across the pipeline, it is a realistic forecast: a 680,000 deal at 50% counts as 340,000.
Group, filter, keep
- Open the search options (the arrow at the right of the search bar) and choose a Group By: Salesperson, Sales Team, Stage, or a date such as Expected Closing by month.
- Add filters such as Won or Lost to see what closed and what did not.
- Under Favorites, Save current search to get the same report next week in one click.
The same analysis for the whole company is under Reporting › Pipeline.
Check what you learned
Loading the quiz…
These lessons were recorded on a working BridgeERP. Start a free trial and follow them on your own.