







Courier Analytics: Volume, on-time performance, cost-to-serve and branch dashboards

+$4.30/mo at 1,000 shipments. Free instant access, no credit card required.

Works with
  • Courier Core
Courier Analytics in the Bridge Courier: Volume, on-time performance, cost-to-serve and branch dashboards
01

The morning read

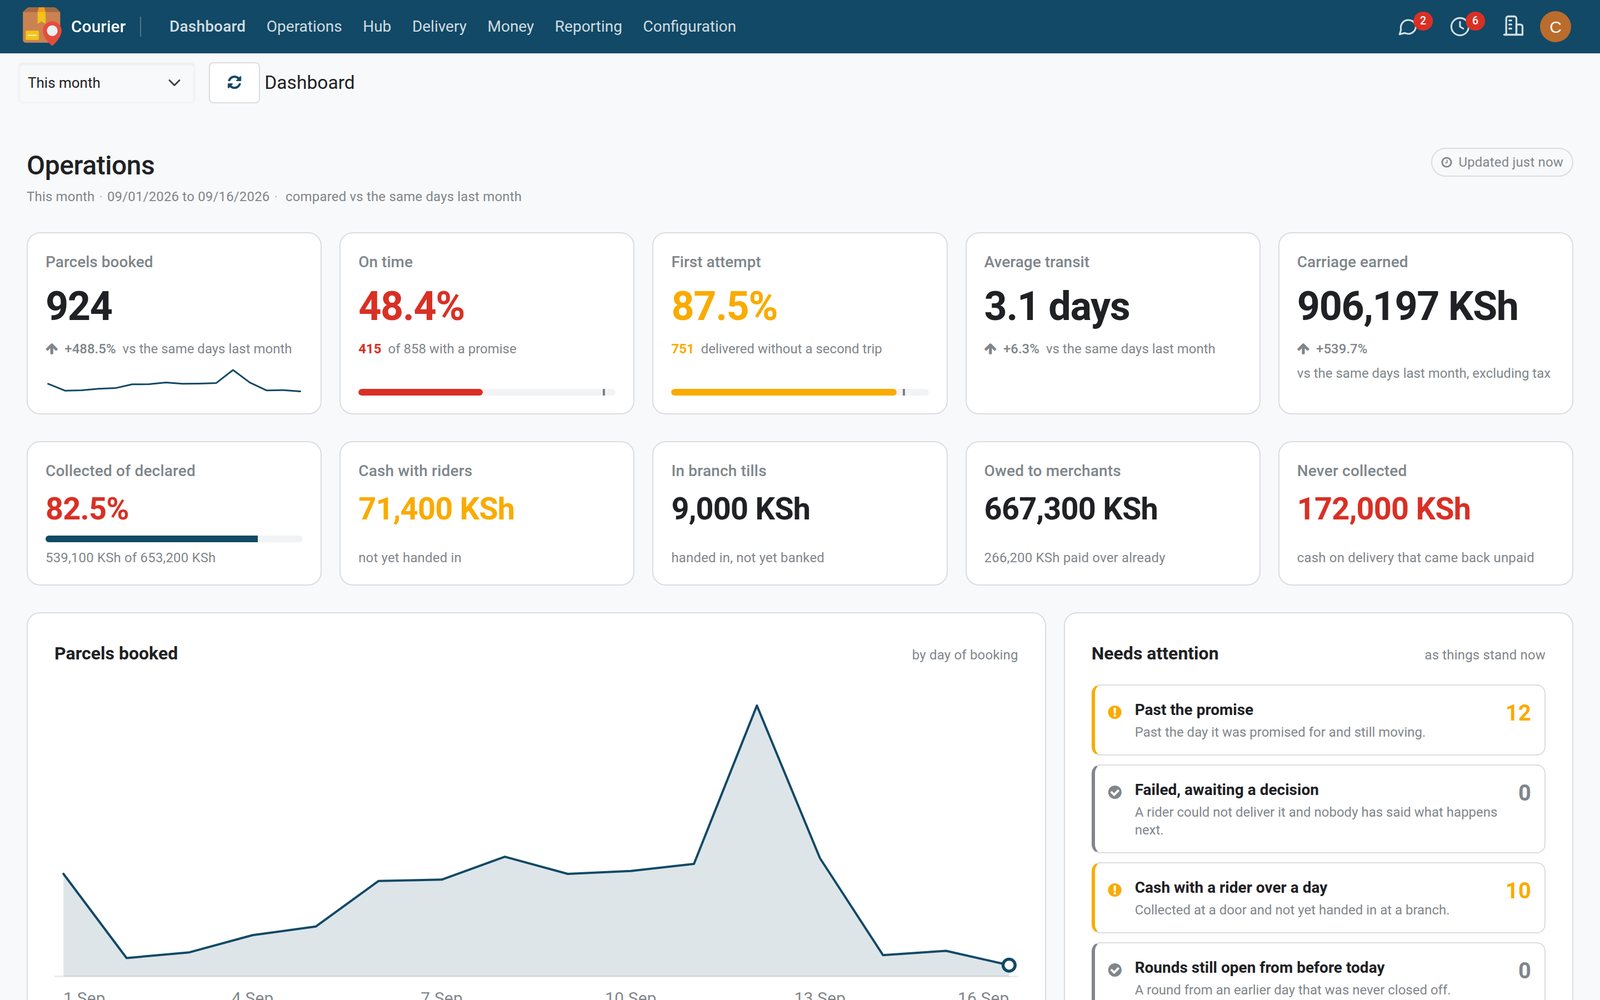
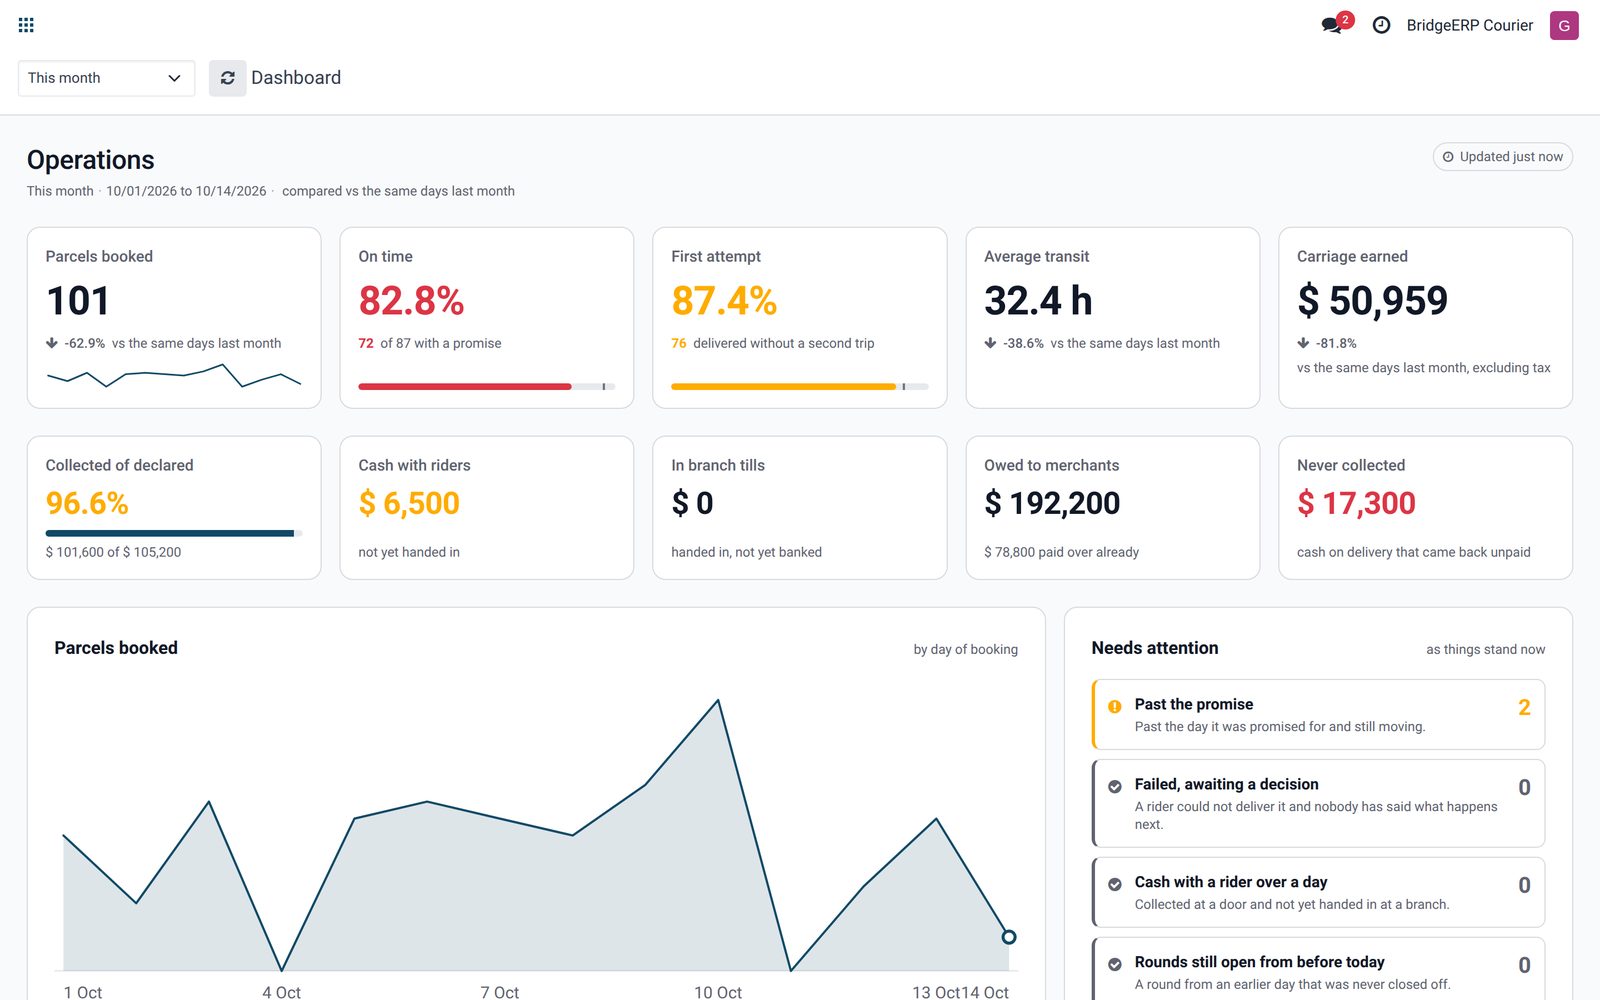
One screen answers what happened and what needs a person: parcels booked, on-time and first-attempt rates, average transit and carriage earned, each against the equivalent preceding period, with the cash still out on the road beside it, and the parcels already slipping past their promise one click away.
Courier Analytics: The morning read
02

Reports a board will actually read

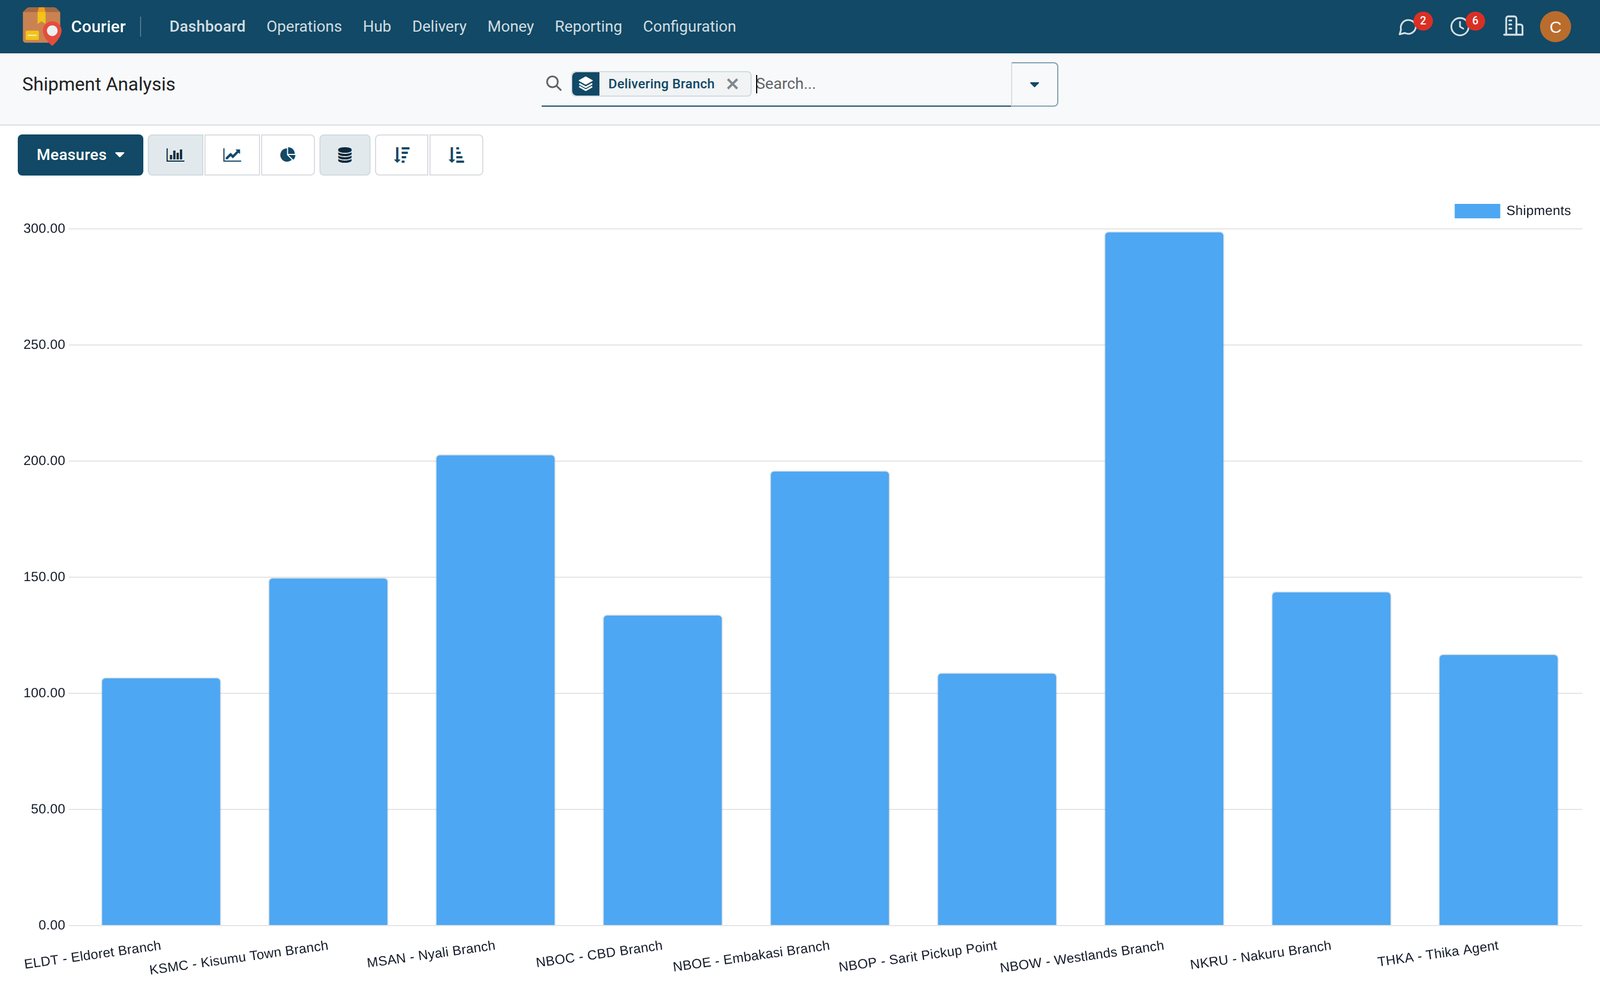
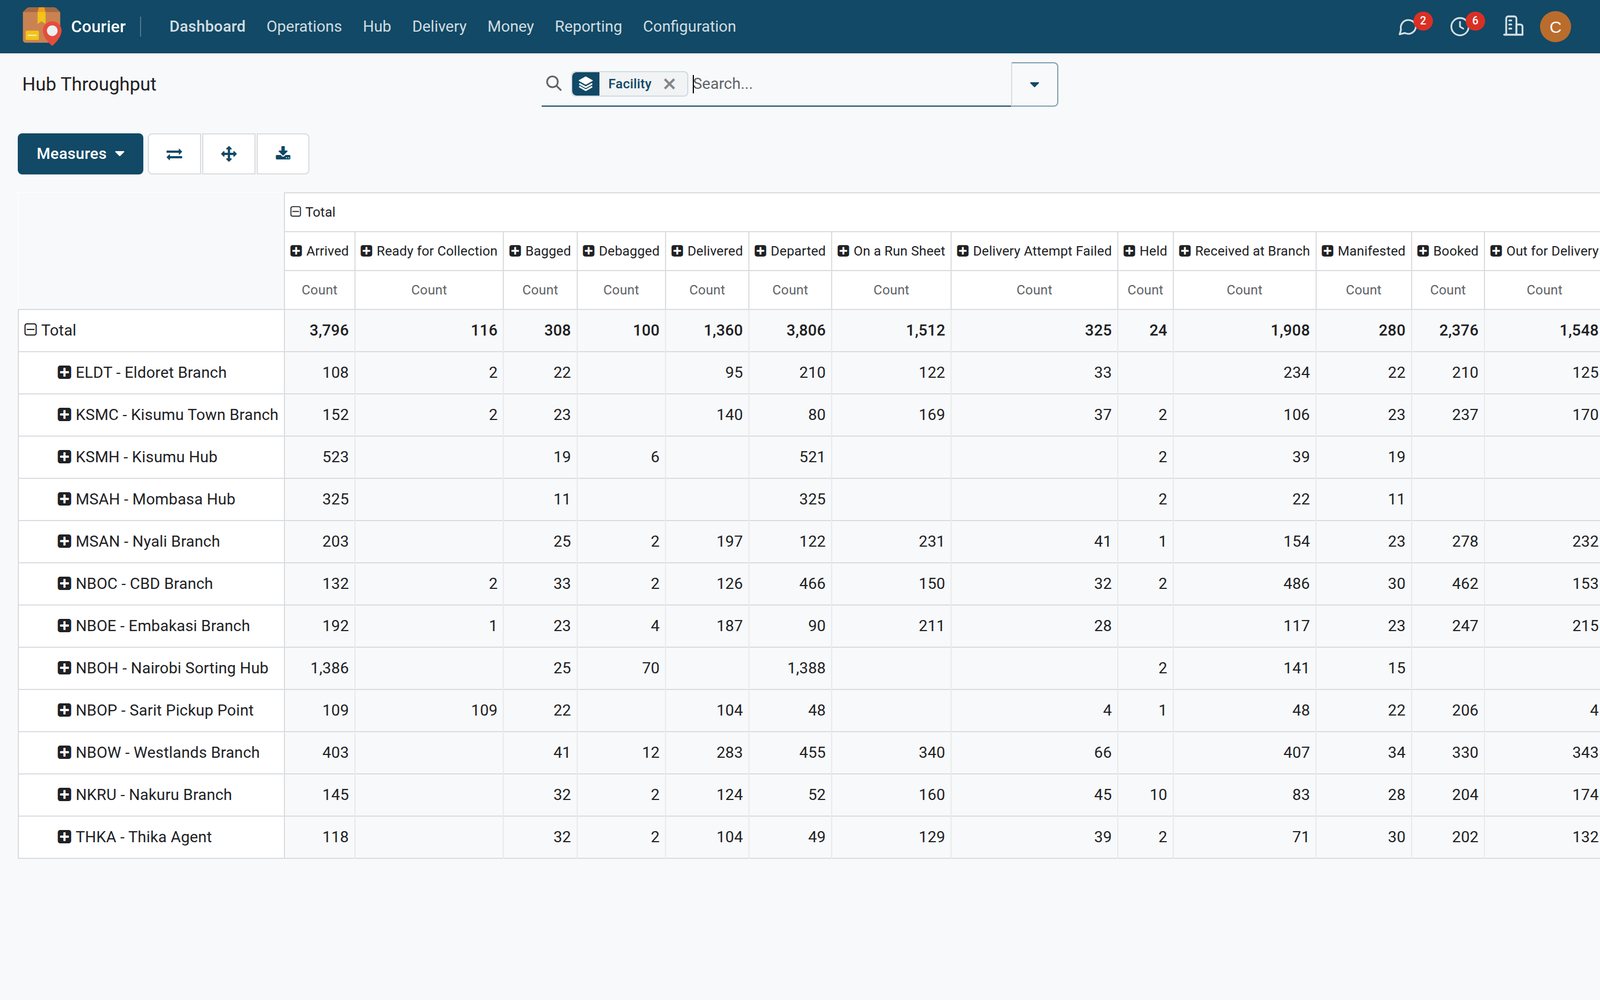
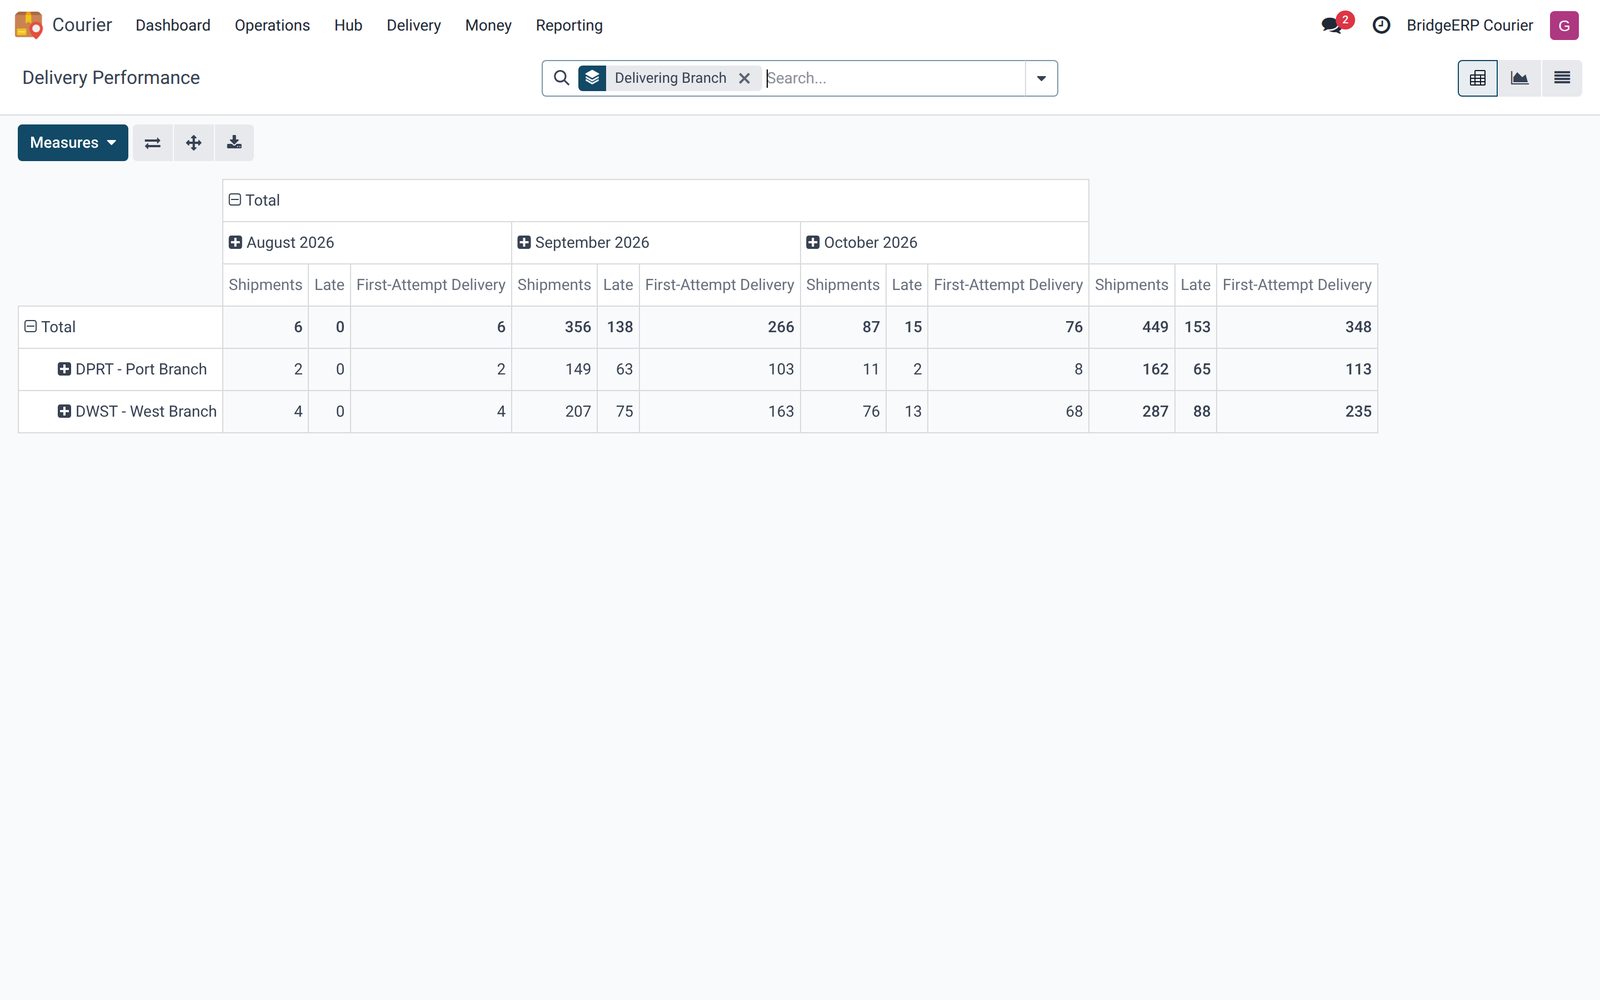
Pivot and graph over every parcel: volumes by branch and month, on-time and first-attempt performance, the reasons doors fail and what each hub handled, all exportable to a spreadsheet.

Courier Analytics: Reports a board will actually read
03

Every lane, merchant and shilling

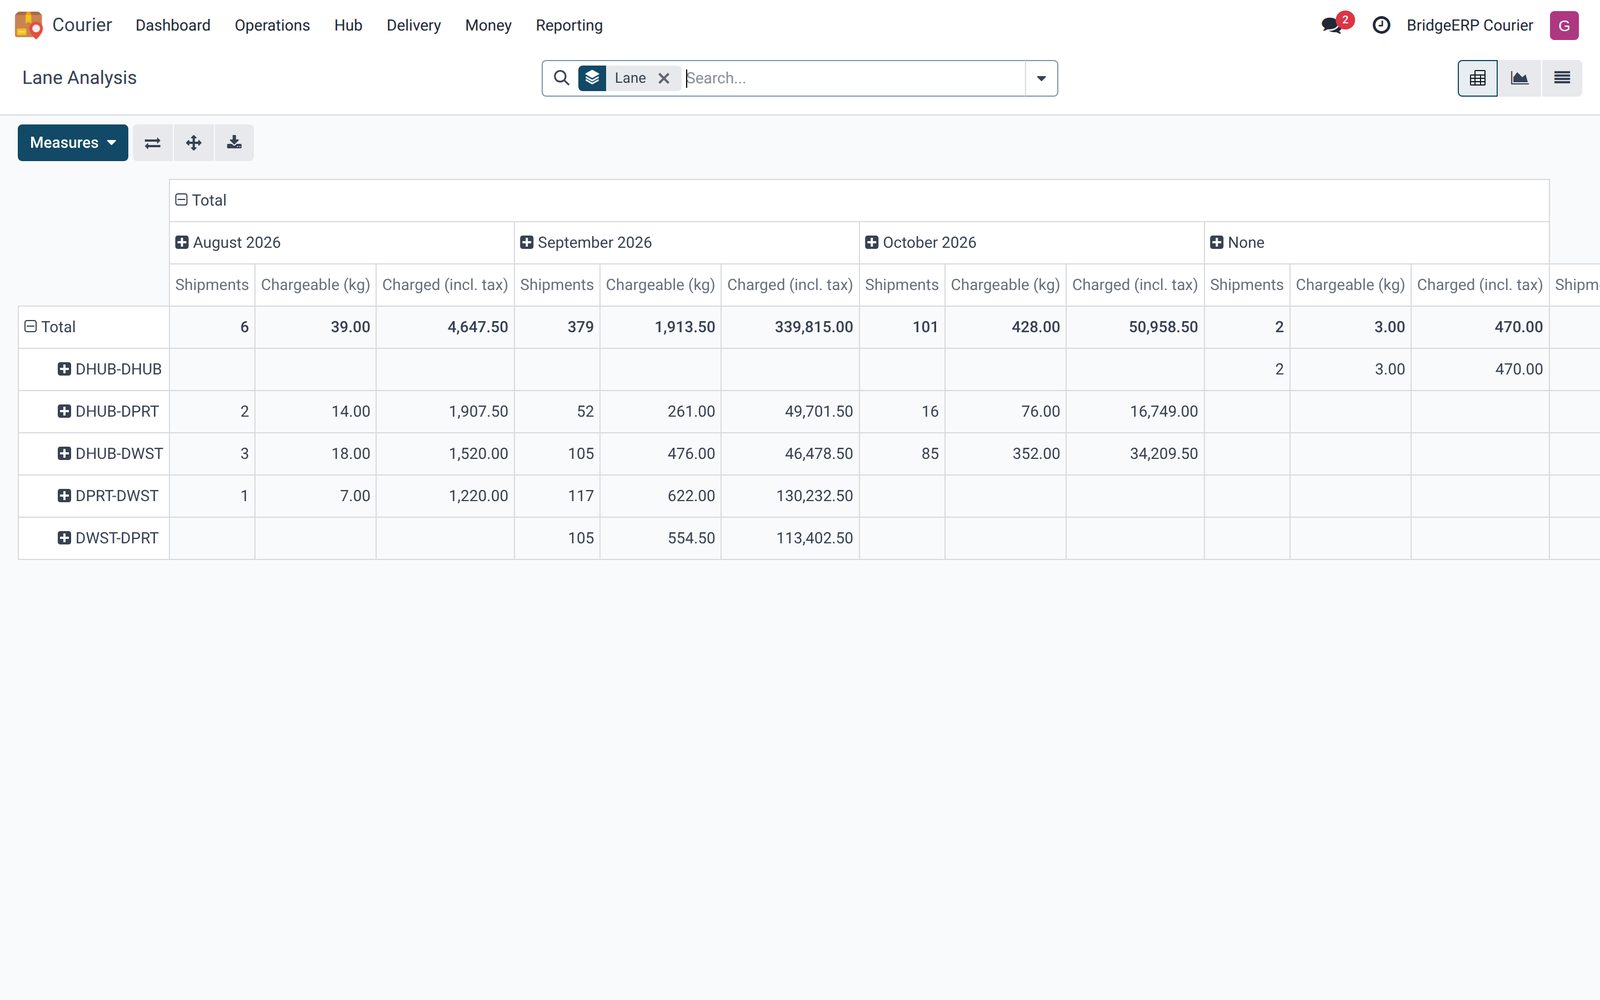
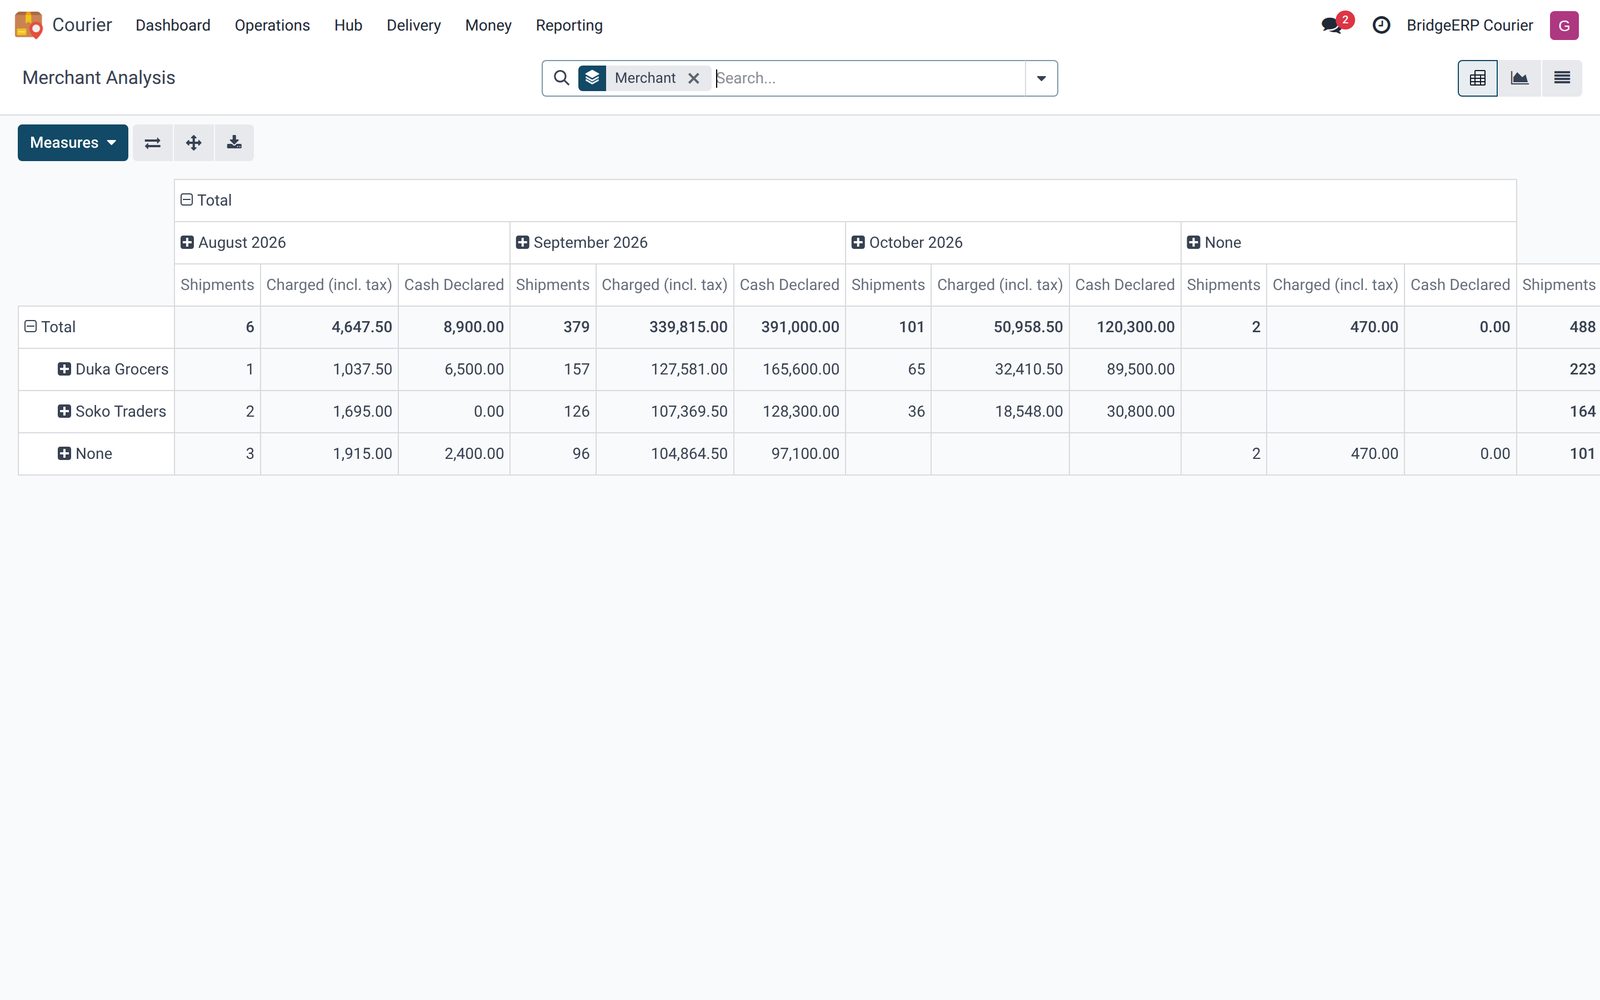
Lane by lane what you carried and what it earned, each merchant’s volume and cash, and where the cash-on-delivery money stands across the whole network.

Courier Analytics: Every lane, merchant and shilling
04

Merchant analysis

Each merchant's volume and cash.

Courier Analytics: Merchant analysis

What's inside

Everything in Courier Analytics

4 items in 1 area, every one shipping with the app today.

  • Everything in the app

    • Operations dashboardNamed periods with a like-for-like comparison.
    • Shipment analysisPivot over every parcel.
    • Lane analysisWhich routes earn and which look busy.
    • Rider performanceStops, first attempt and cash.

Put Courier Analytics to work

Add it to your Bridge Courier plan, priced per shipment, or start a free trial and see it running first.