

 Spreadsheet: Know this month's sales, stock and cash without exporting a thing
BridgeERP Spreadsheet runs the Dashboards app: live spreadsheets that read orders, invoices and stock from your records, with filters, pivots and formulas your admins can edit.
Free instant access. No credit card required.
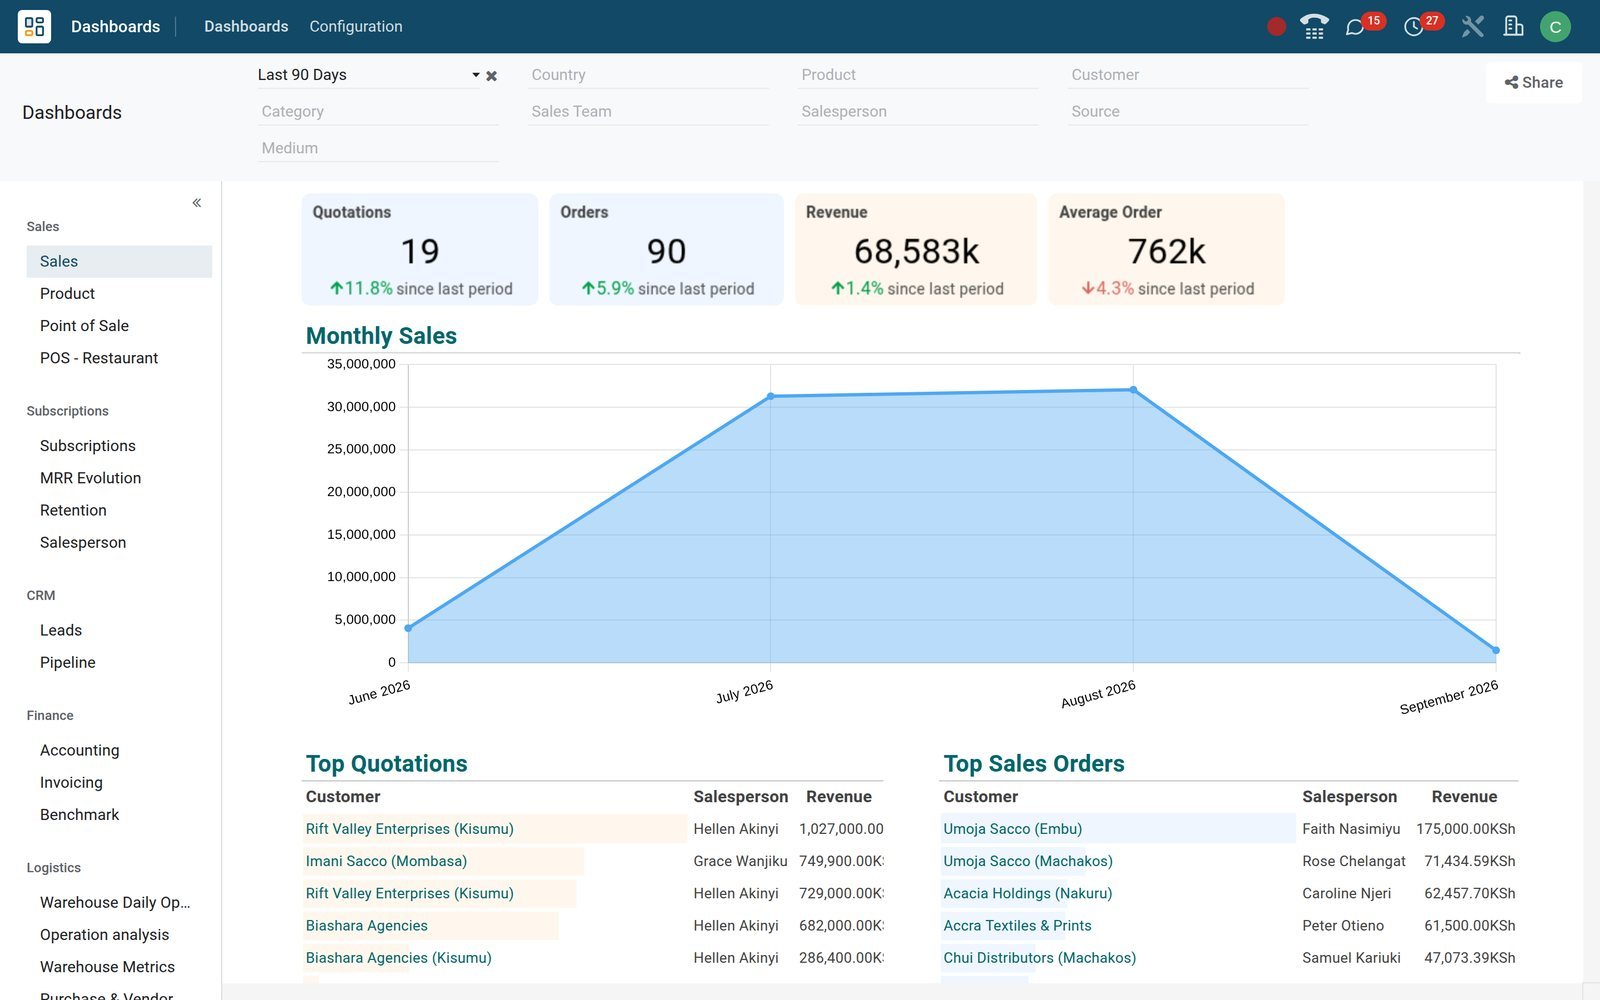
Read the month's sales the moment the dashboard opens
Every standard dashboard is a spreadsheet wired to live records, so there is nothing to export, paste or refresh by hand.
 BridgeERP Core
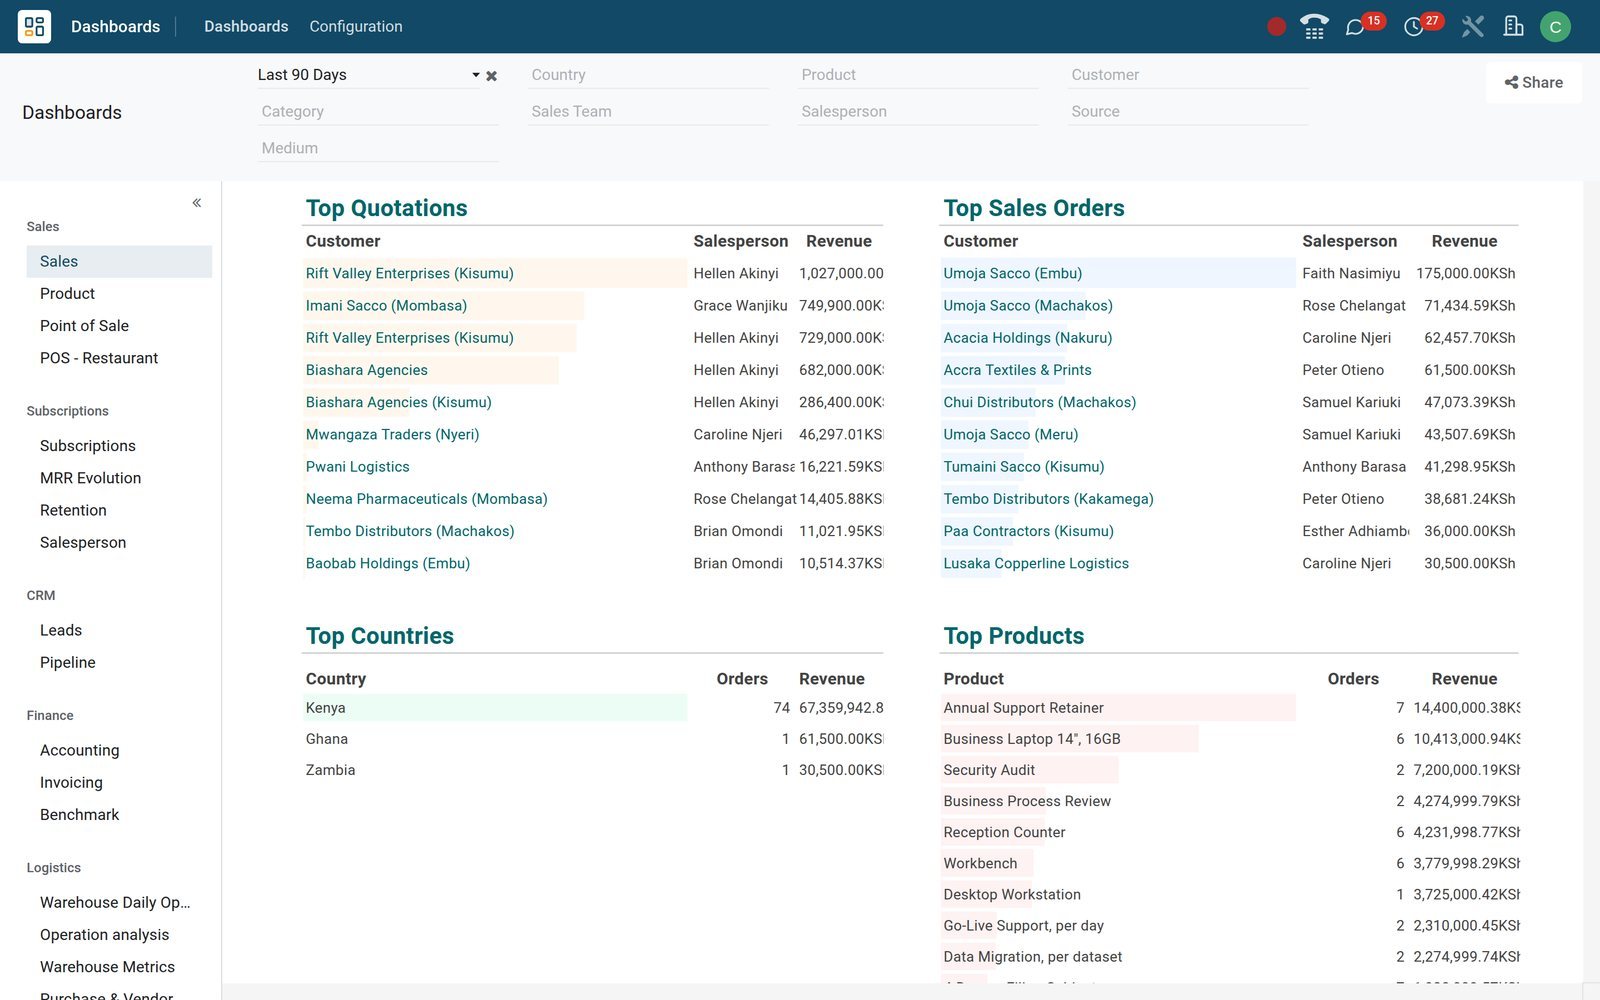
The Sales dashboard, filled from real orders
Dashboards opens on the Sales section: KPI tiles, charts and tables built from confirmed sales orders, recalculated every time the page loads.
By the numbers
Reporting that arrives with the apps
Counted on the BridgeERP demo database, not estimated.
- 24
- ready-made dashboards, each one published in the Dashboards menu for the teams allowed to see it
- 9
- dashboard sections, from Finance, Sales and CRM to Logistics, Human Resources, Marketing and Website
- 17
- dashboard packs installed with their apps, from Accounting and Sales to Payroll and Live Chat
- 77
- pivot views across the installed apps, each one ready to be inserted into a dashboard
Inside the app
Everything a reporting spreadsheet needs, already connected
The Dashboards app and its spreadsheet editor, grouped by what you do with them.
Ready-made dashboards
Invoicing, Accounting, Sales, Pipeline, Warehouse Metrics, Point of Sale and Payroll dashboards arrive with their apps, already filed in the Dashboards menu.
Sections you arrange
Dashboards / Configuration / Dashboards groups every dashboard into sections such as Finance, Sales, CRM and Logistics, shown in the order you set.
Access groups per dashboard
Each dashboard lists the user groups allowed to open it, so payroll figures can stay with HR while sales figures reach the whole team.
A publish switch
Untick Published to take a dashboard out of the menu while you rework it, then switch it back on when the figures are right.
The full spreadsheet editor
Dashboard admins open any dashboard in the spreadsheet editor, with formulas, formatting, charts and pivots on the same grid everyone else reads.
Data from any app
Insert a pivot, list or graph from any app's view into a dashboard; it stays linked to the records and refreshes with them.
Global filters
Date, relation and text filters act on every pivot, list and chart of a dashboard at once, and appear as drop-downs above the grid.
Share links
Share creates a read-only link to a frozen copy of a dashboard, with an Excel file, for people who have no BridgeERP login.
Step by step
From a till receipt to a director's dashboard in five steps
Each step happens in the app that owns it; the dashboard only reads.
- Step 1
Record the day's work
Sales, Point of Sale and Accounting record orders, till tickets and invoices as they happen; nobody retypes them into a workbook.
Sales - Step 2
Open the dashboard
The Dashboards app reads those records and fills the KPI tiles, charts and tables each time a dashboard is opened or reloaded.
BridgeERP Core - Step 3
Filter to the question
Choose a period, or a related record such as a salesperson, in the global filters; every pivot and chart on the page follows.
BridgeERP Core - Step 4
Add the missing view
A dashboard admin inserts a pivot from Inventory, Purchase or Payroll into the dashboard and places it beside the standard charts.
Inventory - Step 5
Share the result
Share sends a read-only link and an Excel copy to a director, auditor or lender who works outside BridgeERP.
BridgeERP Core
Put each dashboard in front of the right people
Sections decide where a dashboard sits in the menu; access groups decide who can open it.
 BridgeERP Core
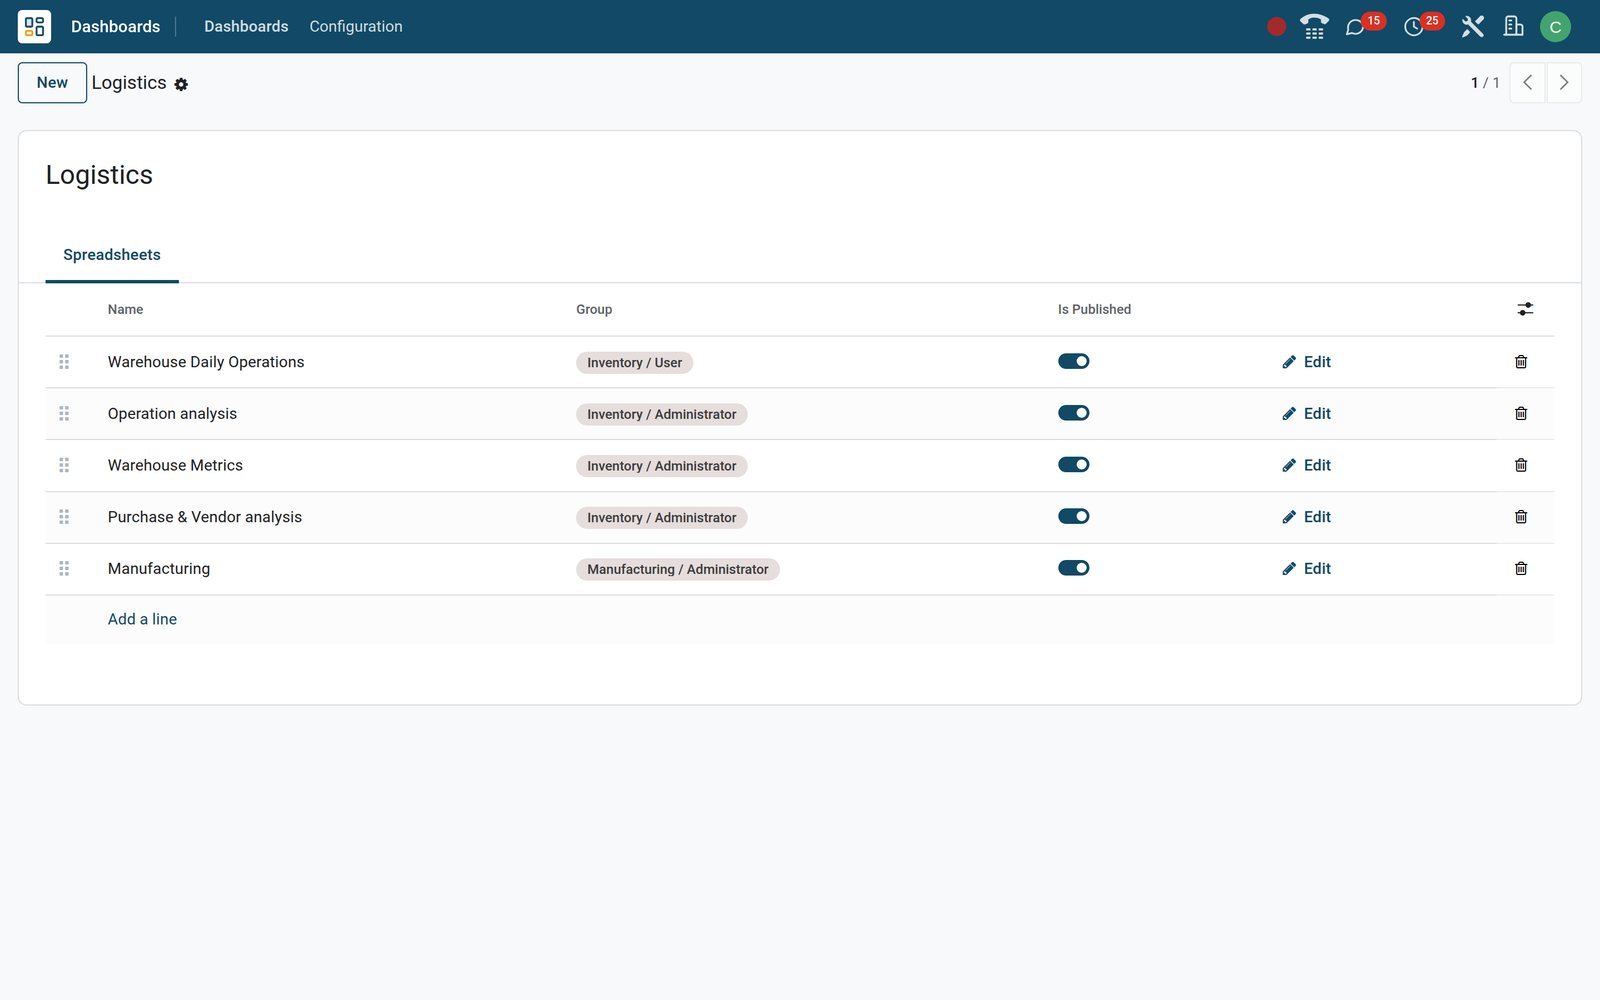
Nine sections, each with its own dashboards
Open a section, such as Logistics with Warehouse Metrics and Manufacturing, to manage its dashboards, their order and the user groups allowed to see each.
Turn a list you already use into a live dashboard table
Lists, pivots and graphs from the apps become spreadsheet data sources that stay linked to the records behind them.
 BridgeERP Core
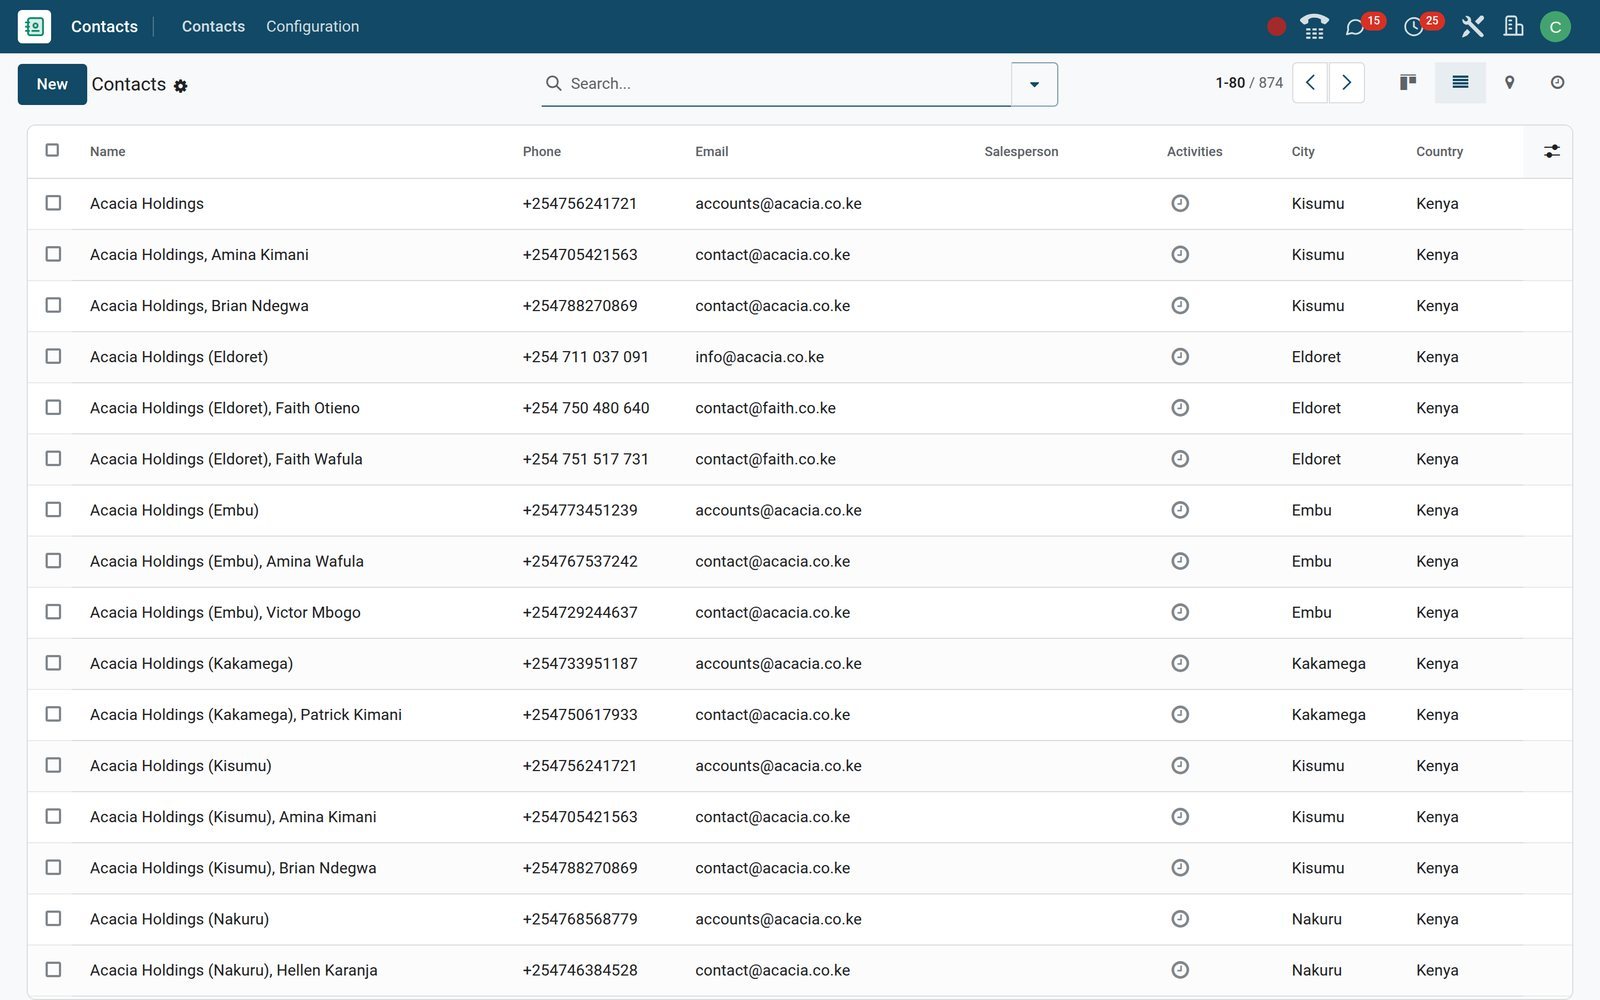
Start from any list, such as Contacts
From a list view such as Contacts, Insert list in spreadsheet places the rows and columns on a dashboard, and they refresh whenever it opens.
Check the numbers from the shop floor or the road
The same dashboards open in a phone browser, laid out for a small screen.
 BridgeERP Core
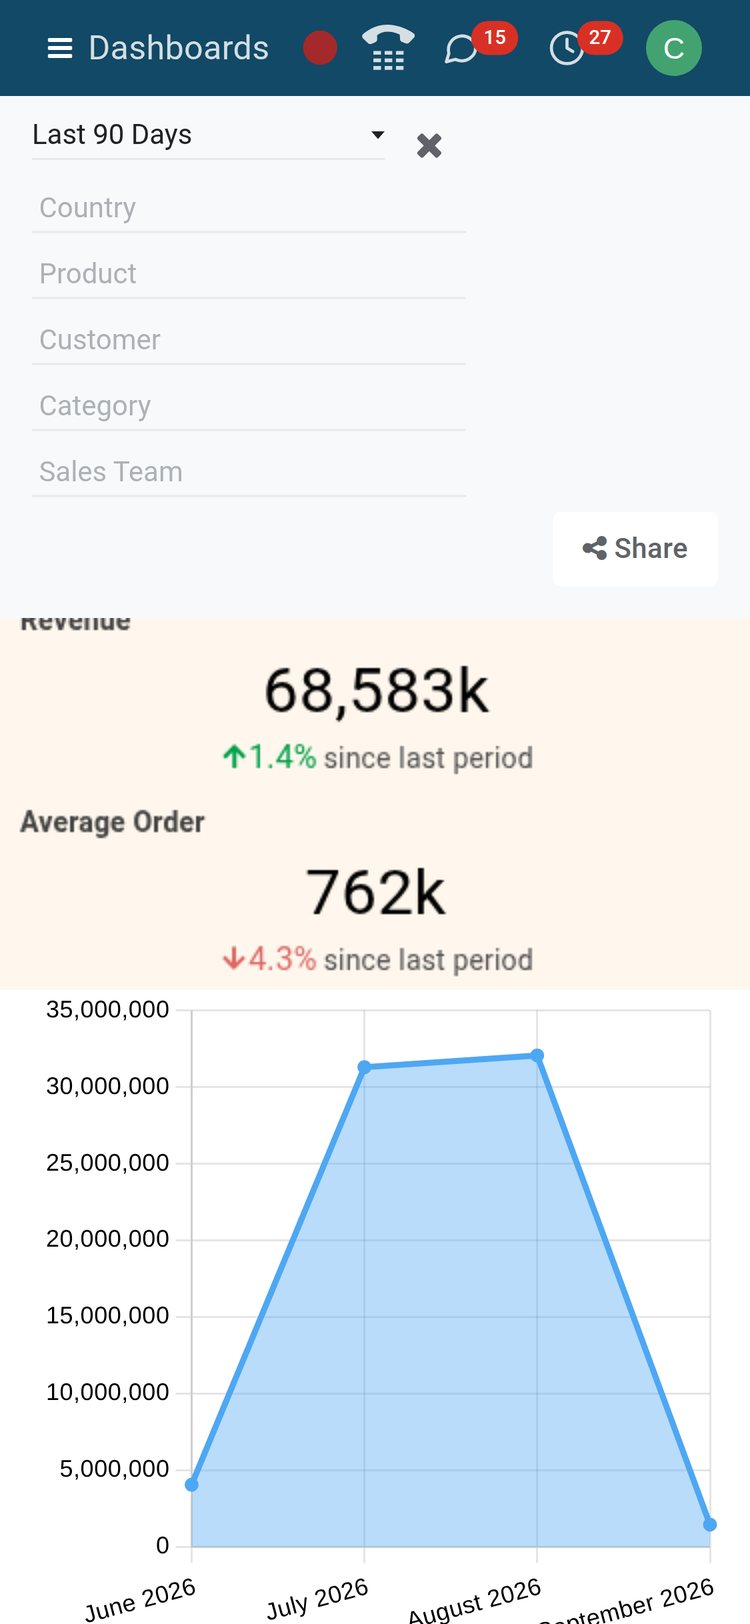
Dashboards on a phone
On a phone the dashboard stacks its KPI tiles and charts in one scrolling column, with the list of dashboards one tap away.
Who uses it
One menu, a different view for every role
Access groups on each dashboard decide which of these people sees which figures.
Owner or director
Opens the Sales, Invoicing and Accounting dashboards for revenue and receivables, without waiting for someone to build a spreadsheet.
Sales manager
Starts the day on the Leads, Pipeline and Sales dashboards to see which opportunities and orders moved since yesterday.
Accountant
Reads the Invoicing and Accounting dashboards and adds cells that pull any account's balance, debit or credit by formula.
Operations lead
Checks Warehouse Metrics, Manufacturing and the purchase dashboards in the Logistics section before the morning stand-up meeting.
HR manager
Opens the Employees and Payroll dashboards, kept away from other staff by the access groups set on each one.
Dashboard admin
Edits dashboards in the spreadsheet editor, inserts new pivots from any app and decides which user groups see each dashboard.
Works with
Every app you run feeds a dashboard
Dashboard packs installed on the demo, with the apps whose records they read.
 SalesSales and Product dashboards built from quotations, confirmed orders and the products you sell.
 CRMLeads and Pipeline dashboards in their own CRM section, built from your opportunities.
 Point of SalePoint of Sale dashboard in the Sales section, fed by the orders rung up at each till.
 AccountingInvoicing and Accounting dashboards in the Finance section, plus formulas that read the ledger.
 InventoryWarehouse Metrics dashboard in the Logistics section, reading the stock records your warehouse creates.
 PurchaseA purchase dashboard sits in the Logistics section beside the inventory and manufacturing dashboards.
 ManufacturingManufacturing dashboard in the Logistics section, reading the production orders from the shop floor.
 ProjectProject dashboard in the Services section for teams that deliver work to clients.
 EmployeesEmployees dashboard in the Human Resources section, open only to the groups you choose.
 PayrollPayroll dashboard beside Employees in Human Resources, visible only to the groups you allow.
 EventsEvents dashboard in the Marketing section, reading the registrations and ticket sales you record.
 eCommerceeCommerce dashboard in the Website section, next to a live chat dashboard for the support team.
In your country
Built for how businesses get paid and taxed, country by country
Payments, tax and currencies found on the demo, and how each one reaches a dashboard.
Mobile Money at the till
Point of Sale takes Cash, Card and Mobile Money; the POS orders pivot splits takings by payment method for any dashboard.
E-invoiced invoices
Invoices sent to the tax authority from Accounting, such as KRA eTIMS on the demo, are ordinary posted invoices, so the Invoicing dashboard counts them straight away.
Every company's currency
Figures show in each company's currency, and a currency-rate formula converts between KES, USD and ETB inside any cell.
Several companies
Dashboards read only the companies ticked in the company switcher, and a dashboard can be tied to a single company when needed.
Ledger checks in a cell
Accounting formulas return the balance of any account code, such as a bank or VAT account, straight into a dashboard cell.
Phones first
Owners out on site open the same dashboards in a phone browser, with tiles and charts stacked for a small screen.
Reports and control
The dashboards already waiting in the menu
Found on the demo database, grouped by the section they sit in.
Finance
Invoicing and Accounting dashboards summarise posted customer invoices and journal entries for the finance team.
Sales
Sales, Product and Point of Sale dashboards share the Sales section, covering orders, products and till takings.
CRM
Leads and Pipeline dashboards sit in their own CRM section for the sales team and its managers.
Logistics
Warehouse Metrics, Manufacturing and purchase dashboards share the Logistics section, five dashboards in all for operations.
Services
The Project dashboard sits in the Services section for teams that sell and deliver project work.
Human Resources
Employees and Payroll dashboards are grouped under Human Resources, behind the access groups HR chooses.
Website
eCommerce and live chat dashboards sit together in the Website section for online sales and support.
Marketing and subscriptions
The Events dashboard sits in Marketing, and a Subscriptions dashboard follows recurring subscription orders.
Getting started
Useful on day one, yours by the end of the month
What happens when you switch the apps on, and the few settings worth making before go-live.
Dashboards arrive with the apps
Install Sales, Inventory or Payroll and its dashboard pack comes too, published and filed in the right section of the menu.
Sample figures until data arrives
While an app has no records yet, its dashboard shows sample figures, so a new team sees the finished layout on day one.
Arrange the menu
In Dashboards / Configuration / Dashboards, rename sections, set their order and move dashboards to where your teams expect them.
Set who sees what
Tick the user groups on each dashboard before go-live, so every role opens only the figures meant for it.
Default filter values
Give each global filter a default, such as the current month, so dashboards open on the right period and load faster.
Your own dashboards
Start a custom dashboard from a blank spreadsheet or rework a standard one, then insert pivots from the apps you run.
What sets it apart
What changes when the spreadsheet lives inside the ERP
Features that retire the weekly export-and-paste routine.
No export loop
Figures load from the database each time a dashboard opens, so nobody rebuilds last week's workbook from a CSV file.
Formulas that read the ledger
Accounting formulas bring an account's balance, debit or credit for a chosen period straight into a cell, next to your own maths.
Cells that open records
Link a cell to any menu, so a click on the invoice total takes the reader straight to the Invoices list.
Editing together
Two admins can edit the same dashboard at once; every change is stored as a revision of the underlying spreadsheet.
Period against period
A date filter can apply a period offset to a second pivot, putting this quarter beside the previous one on one grid.
Pivots you can calculate with
Inserted pivot values sit in ordinary cells, so ratios, targets and conditional colours can be built on top of them.
Questions
Questions about Spreadsheet
Not covered here? Contact us.
Do we need Excel or another spreadsheet licence?
No. Dashboards open in the browser inside BridgeERP. When someone outside the company wants a file, the Share link also offers an Excel copy of the dashboard.
Where do the dashboard figures come from?
From the records in your apps, such as sales orders, till orders, invoices and stock moves. A dashboard reloads its data every time it is opened.
Can we build our own dashboards?
Yes. Users with dashboard admin rights can rework a standard dashboard or start from a blank spreadsheet, then insert pivots, lists and graphs from any app view.
Who can see a dashboard?
Only members of the user groups set on it. Figures also follow the companies selected in the company switcher, so each company's numbers stay separate.
Can we share a dashboard with our bank or board?
Yes. Share creates a read-only link to a frozen copy of the dashboard, with an Excel download, for people who have no BridgeERP login.
Can I filter by month, salesperson or shop?
Yes. Global filters cover dates, related records such as a salesperson or a shop, and text. One filter drives every pivot, list and chart on the dashboard.
Does it work on a phone?
Yes, in the phone browser. KPI tiles and charts are stacked in a single column, and the list of dashboards is one tap away.
What does a new company see before it has any data?
Dashboards whose apps have no records yet show sample figures, so your team sees the finished layout; real numbers replace them as records arrive.
Put Spreadsheet to work
Add it to your plan and pay only for what you use, or see it running on your own demo first.